 The deepest
layer of the Sun you can see is the photosphere. The word
``photosphere'' means ``light sphere''. It is called the ``surface'' of the
Sun because at the top of it, the photons are finally able to escape to space.
The photosphere is about 500 kilometers thick.
Remember that the Sun is totally gaseous, so the surface is not something you
could land or float on. It is a dense enough gas that you cannot
see through it. It emits a continuous spectrum. Several methods of measuring
the temperature all determine that the Sun's photosphere has a temperature of
about 5840 K.
The deepest
layer of the Sun you can see is the photosphere. The word
``photosphere'' means ``light sphere''. It is called the ``surface'' of the
Sun because at the top of it, the photons are finally able to escape to space.
The photosphere is about 500 kilometers thick.
Remember that the Sun is totally gaseous, so the surface is not something you
could land or float on. It is a dense enough gas that you cannot
see through it. It emits a continuous spectrum. Several methods of measuring
the temperature all determine that the Sun's photosphere has a temperature of
about 5840 K.
Another method uses the flux of energy reaching the Earth and the inverse square
law. Recall from the Stellar
Properties chapter that the flux is the amount of
energy passing through a unit area (e.g., 1 meter2) every second. From the
inverse square law of light brightness, you find that the solar flux at
the Earth's distance = the Sun's surface flux × (Sun's radius/Earth's
distance)2 = 1380 Watts/meter2. Since
the Sun's photosphere is approximately a thermal radiator, the flux of energy at
its surface = ![]() × (the Sun's surface temperature)4,
where
× (the Sun's surface temperature)4,
where ![]() is the
Stefan-Boltzmann constant. Rearranging the equation, the photosphere's
temperature = [(solar flux at Earth)/
is the
Stefan-Boltzmann constant. Rearranging the equation, the photosphere's
temperature = [(solar flux at Earth)/![]() ) ×
(Earth distance/Sun's radius)2]1/4.
) ×
(Earth distance/Sun's radius)2]1/4.
These two methods give a rough temperature for the Sun of about 5800 K. The upper layers of the photosphere are cooler and less dense than the deeper layters, so you see absorption lines in the solar spectrum. Which element absorption lines are present and their strength depends sensitively on the temperature. You can use the absorption line strengths as an accurate temperature probe to measure a temperature of about 5840 K.
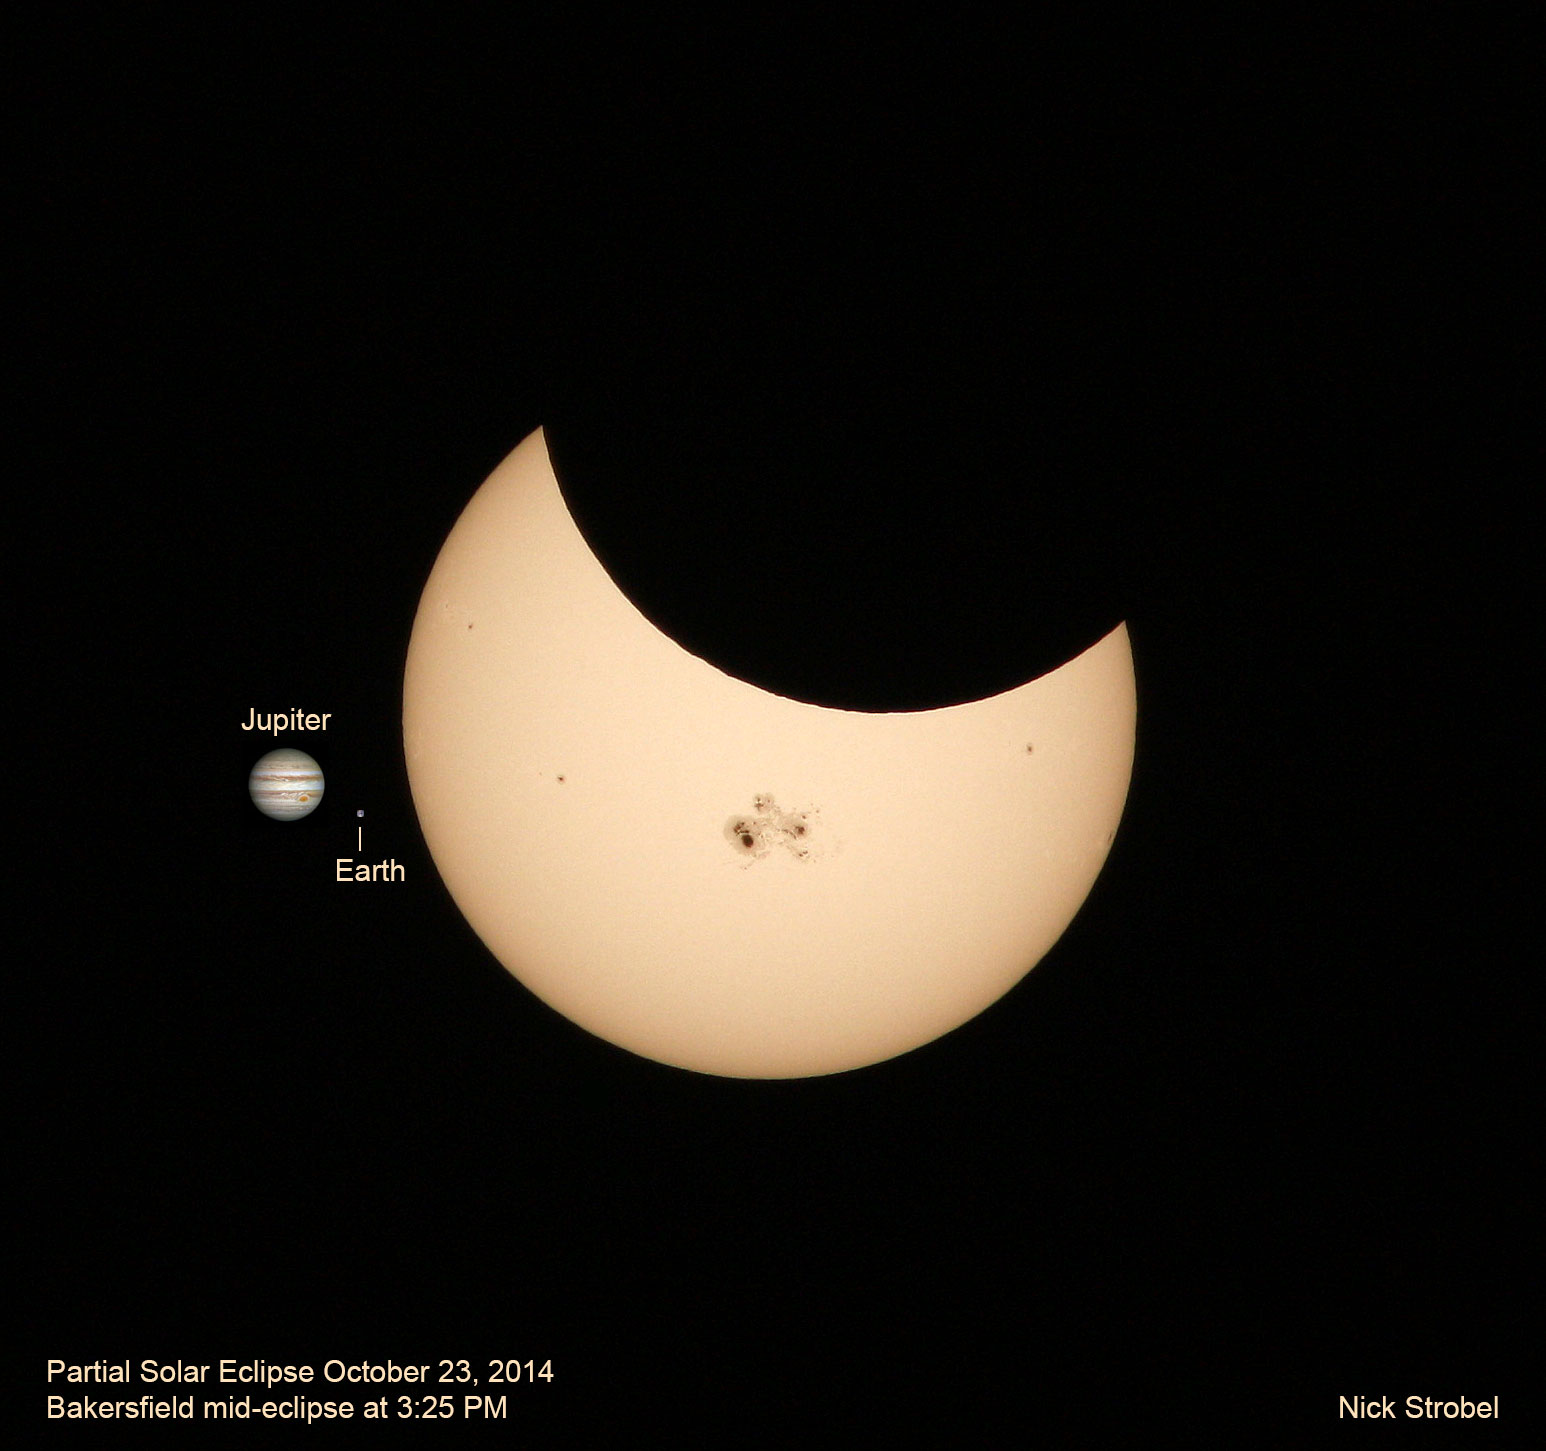
Sun at mid-eclipse 2014 showing size of sunspot group compared to Jupiter and Earth
 --
-- 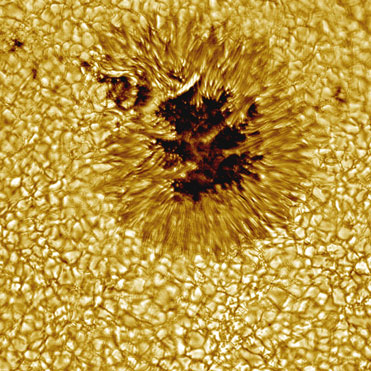
Sunspots + granulation in the photosphere (left: courtesy of Peter N. Brandt; right: courtesy of NSO)
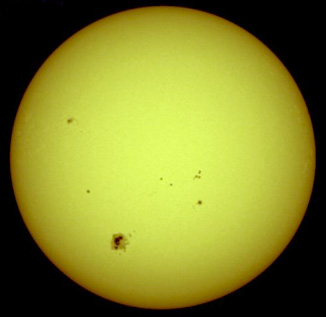
Galileo discovered that the Sun's surface is sprinkled with small dark regions called sunspots. Sunspots are cooler regions on the photosphere. Since they are 1000--1500 K cooler than the rest of the photosphere, they do not emit as much light and appear darker. They can last a few days to a few months. Galileo used the longer-lasting sunspots to map the rotation patterns of the Sun. Because the Sun is gaseous, not all parts of it rotate at the same rate. The solar equator rotates once every 25 days, while regions at 30° above and below the equator take 26.5 days to rotate and regions at 60° from the equator take up to 30 days to rotate.
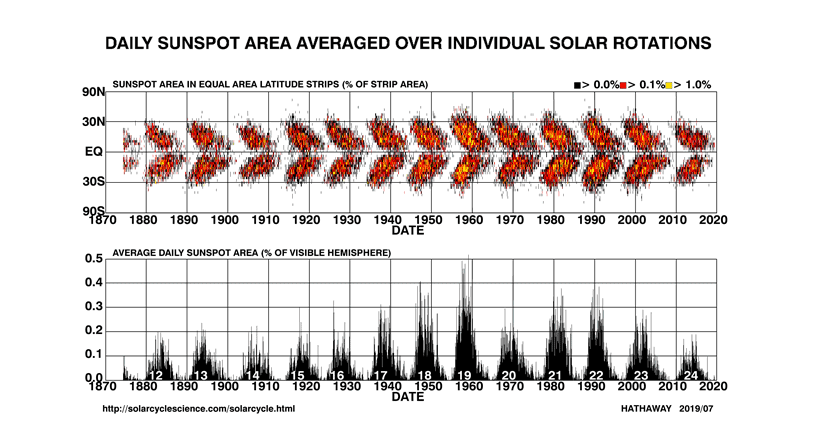
Hundreds of years of observing the sunspots on the Sun shows that the number of sunspots varies in a cycle with an average period of 11 years. At the start of a sunspot cycle the number of sunspots is at a minimum and most of them are at around 35° from the solar equator. At solar maximum when the sunspot number peaks about 5.5 years later, most of the sunspots are within just 5° of the solar equator.
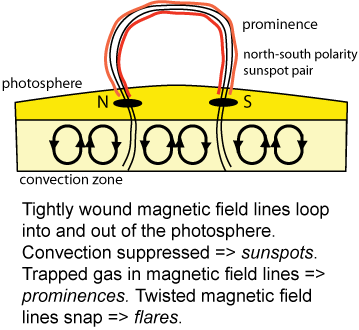
Sunspots are regions of strong magnetic fields. This affects the spectral lines in the sunspot spectra. Each absorption lines will split up into multiple components. The amount of separation between the components measures the strength of the magnetic field. The magnetic field is somehow responsible for the sunspot cycle. In one 11-year cycle the leading sunspot in a sunspot group will have a north magnetic pole while the trailing sunspot in the group will have a south magnetic pole. In the next 11-year cycle the poles will switch so the total cycle is 22 years long. Sunspots form where twisted magnetic field lines rise out of the photosphere and then loop back down into the photosphere and deeper layers. The magnetic field lines suppress the convection at those points on the photosphere so energy has a harder time leaking out at those points on the photosphere---they are cooler than the rest of the photosphere.
How many sunspots are there today on the Sun? See today's image of the photosphere at the SOHO website or the National Solar Observatory's GONG website or the Solar Dynamics Observatory website. The Sunspot Cycle page of the Solar Physics website at the Marshall Space Flight Center has a link to the sunspot numbers back to 1750 and David Hathaway has current data on the Solar Cycle Science website. The National Oceanic & Atmospheric Administration (NOAA) is now tasked with keeping watch on solar particle outflow and its interaction with our magnetic field (called "space weather") and it displays its tracking of the sunspot number on its Solar Cycle Progression page of the Space Weather Prediction Center.
At solar maximum there are more prominences and solar flares. Prominences are bright clouds of gas forming above the sunspots in the chromosphere that follow the magnetic field line loops. So-called ``quiet'' ones form in the corona (the Sun's atmosphere) about 40,000 kilometers above the surface. Sometimes they form loops of hydrogen gas as the gas follows the loops in the magnetic field. Quiet prominences last several days to several weeks. ``Surge'' prominences lasting up to a few hours shoot gas up to 300,000 kilometers above the photosphere.
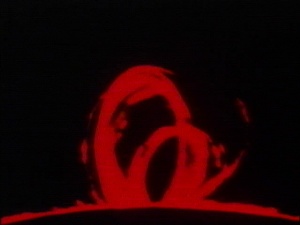
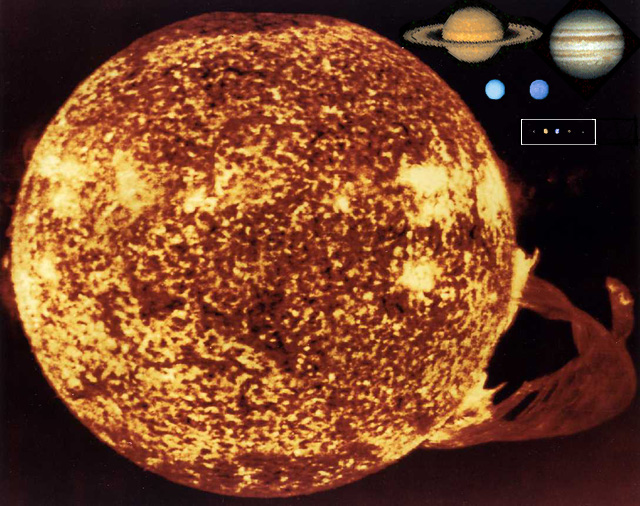
Solar flares are eruptions more powerful than surge prominences (a flare is shown in the Sun + planets montage above). They will last only a few minutes to a few hours. They probably form when the magnetic field lines get so twisted, that they snap violently, releasing the trapped material. A lot of ionized material is ejected in a flare. Unlike the material in prominences, the solar flare material moves with enough energy to escape the Sun's gravity. When this burst of ions reaches the Earth, it interferes with radio communication. Sometimes a solar flare will cause voltage pulses or surges in power and telephone lines. Brownouts or blackouts may result. Humans traveling outside the protection of the Earth's magnetic field will need to have shielding from the powerful ions in a flare.
High resolution observations of the solar surface show a honeycomb pattern called granulation made of bright spots of convection 700 to 1000 kilometers across (see the picture above). Hot gas rises in the middle of each granule bringing energy from the interior to the surface and sinks back down on the border of a granule. The hot gas rising in the center is brighter than the cooler gas sinking at the borders. Each granule will last for about 8 minutes. High resolution images and movies of the Sun's surface around a sunspot are available on The Institute for Solar Physics webpage for their 2002 Nature article and Picture of the month section of the Kiepenheuer-Institut fur Sonnenphysik (check the archive). Beginning in mid-2020, the Daniel K. Inouye Solar Telescope (DKIST) on the summit of Haleakala, Maui, in Hawai'i will reveal unprecedented details of the Sun's surface using a combination of the largest mirror for a solar telescope (4-meters diameter) plus state-of-the-art adaptive optics. DKIST's "first light" image below released on January 29, 2020 provides an example of what we will see when science operations begin in July 2020.
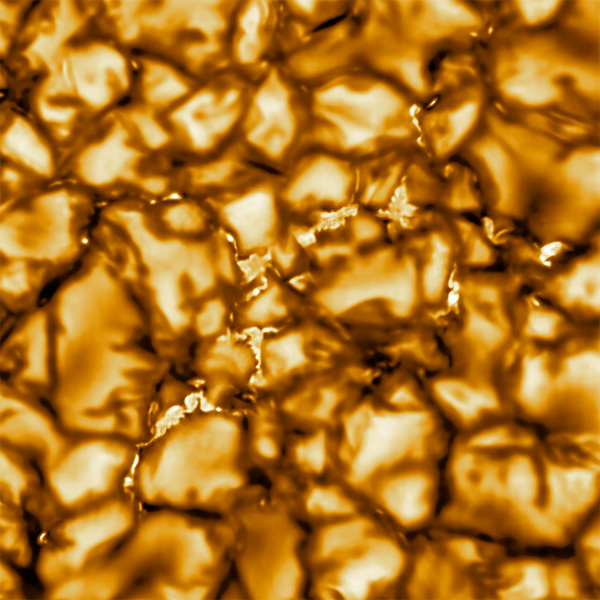
The "first light" image above from DKIST shows features as small as 30 km. In addition to usual bright centers and dark edges of the convections cells seen with earlier solar telescopes, this image shows for the first time very clearly the thin bright markers of magnetic fields in the dark edges that might be responsible for channeling energy up into the corona.
 --
-- 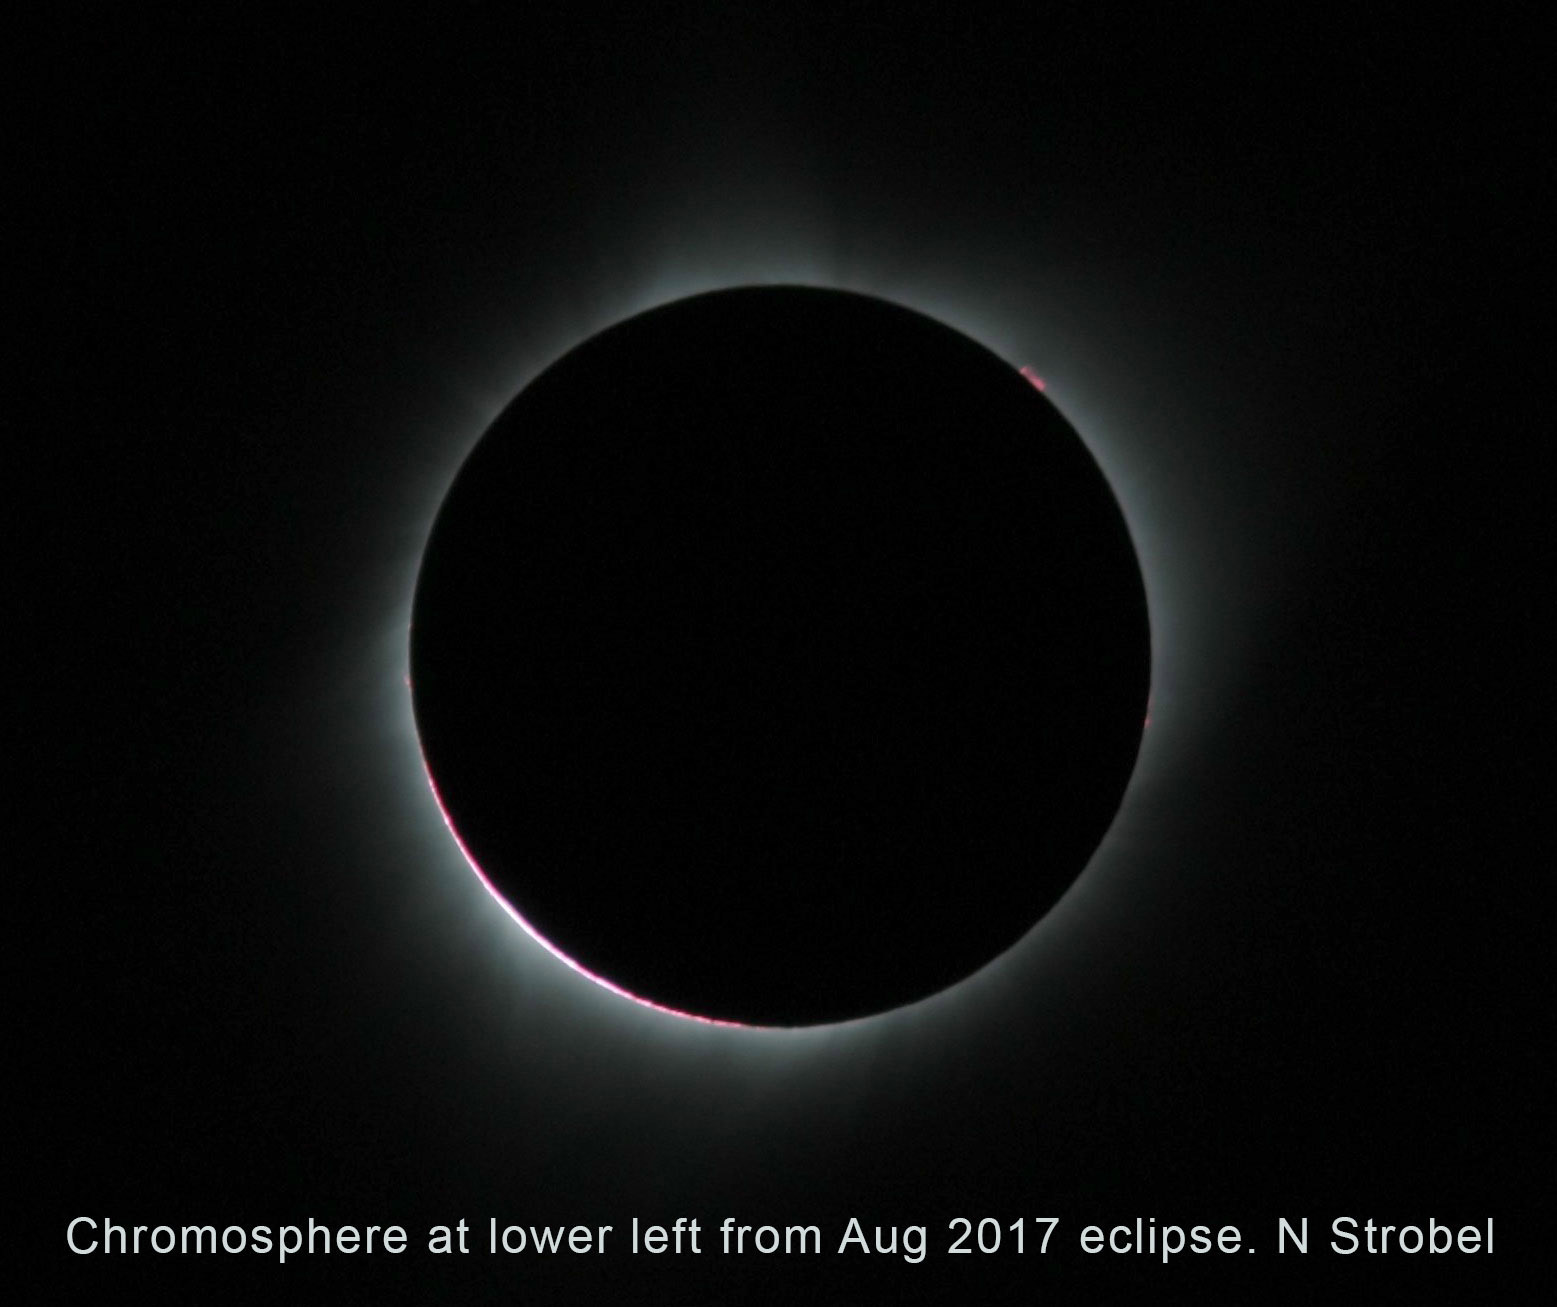
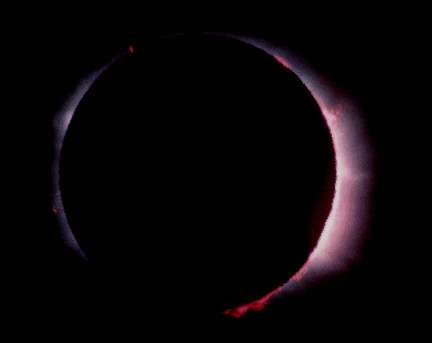
The thin chromosphere is visible in these solar eclipse pictures.
Images of today's chromosphere are available on the National Solar Observatory's GONG website.
 --
-- 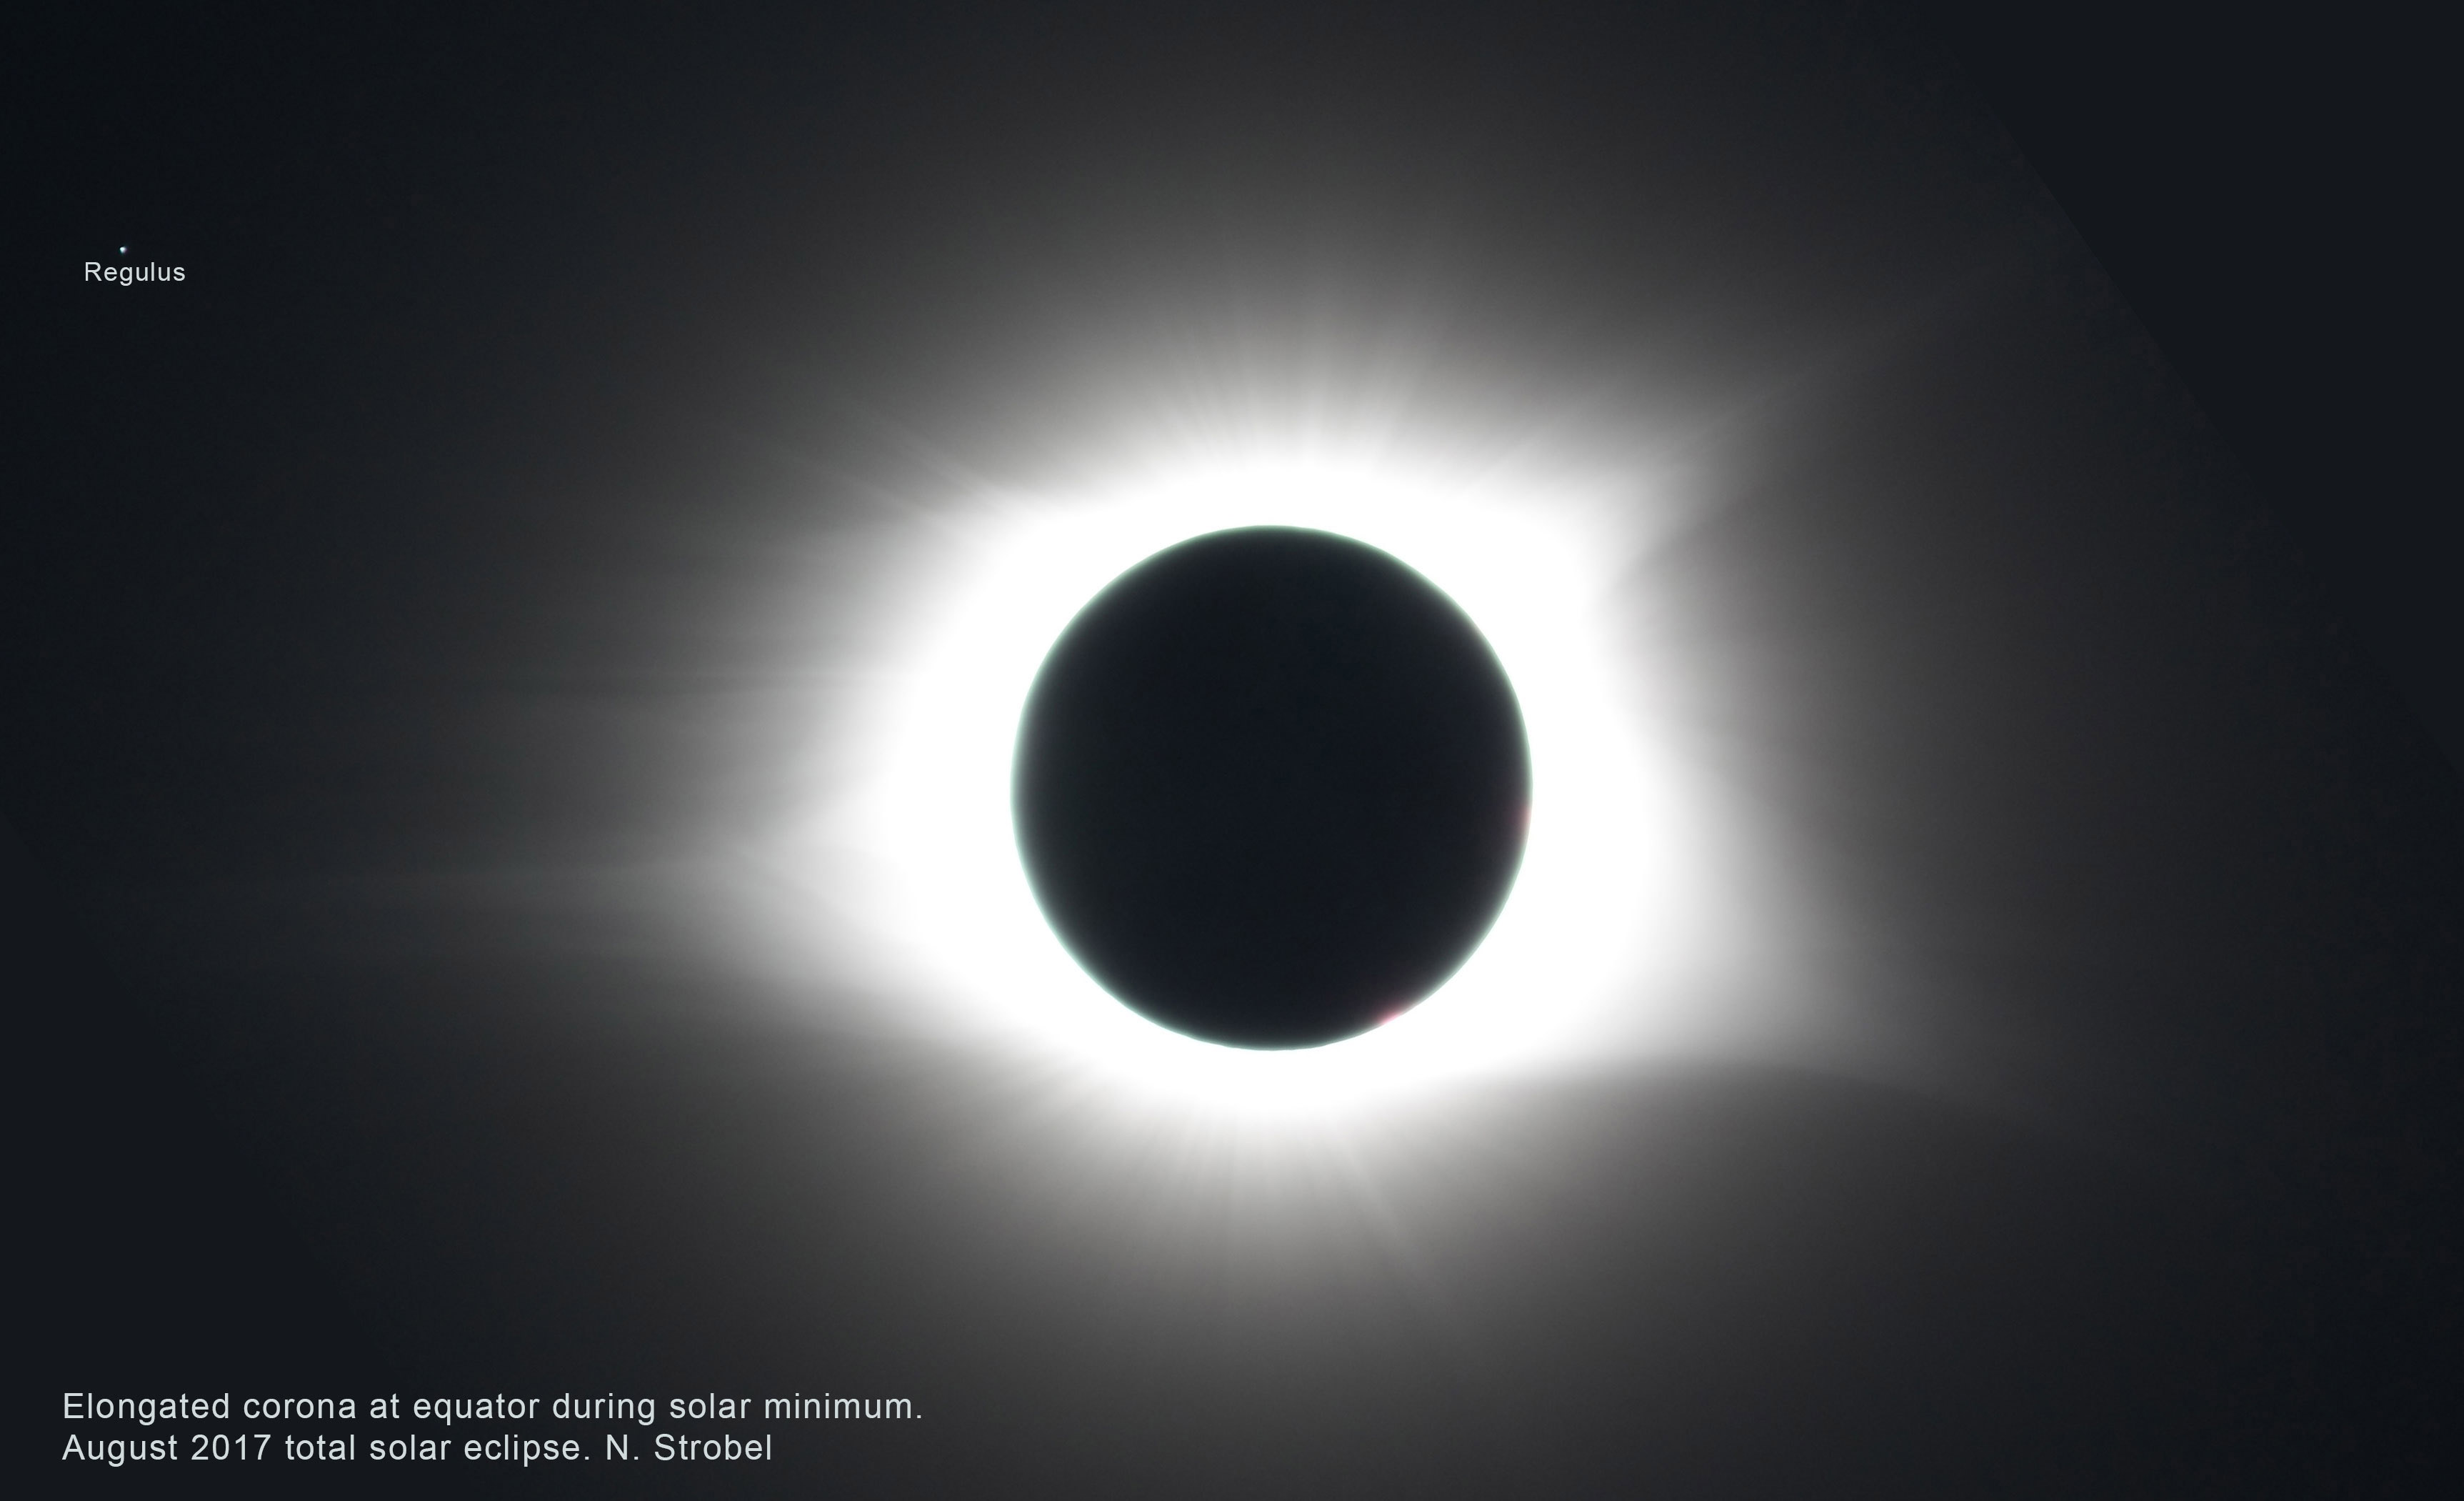
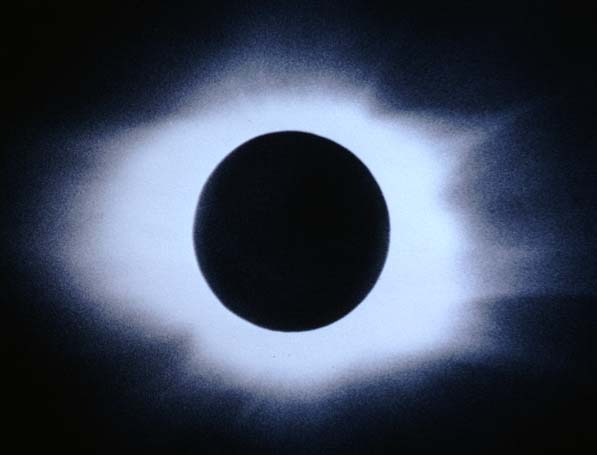
Total solar eclipse in 1973 (left or top, courtesy of
Fred
Espenak) and in 2017 (right or bottom) showing the corona near solar maximum activity (1973) and near solar minimum activity (2017). During solar maximum the corona looks more uniform around the entire sun while during solar minimum the corona has bright bulbs closer to the equator, called helmet streamers, and fainter, straight structures at the poles called polar plumes. For more about the corona shape connection to solar activity, see the Eclipse 2017 website's Solar Corona page.
The corona is known to be very hot because it has ions with many electrons removed from the atoms. At high enough temperatures the atoms collide with each other with such energy to eject electrons. This process is called ionization. At very high temperatures, atoms like iron can have 9 to 13 electrons ejected. Nine-times ionized iron is only produced at temperatures of 1.3 million K and 13-times ionized iron means the temperature gets up to 2.3 million K! During strong solar activity, the temperature can reach 3.6 million K and lines from 14-times ionized calcium are seen.
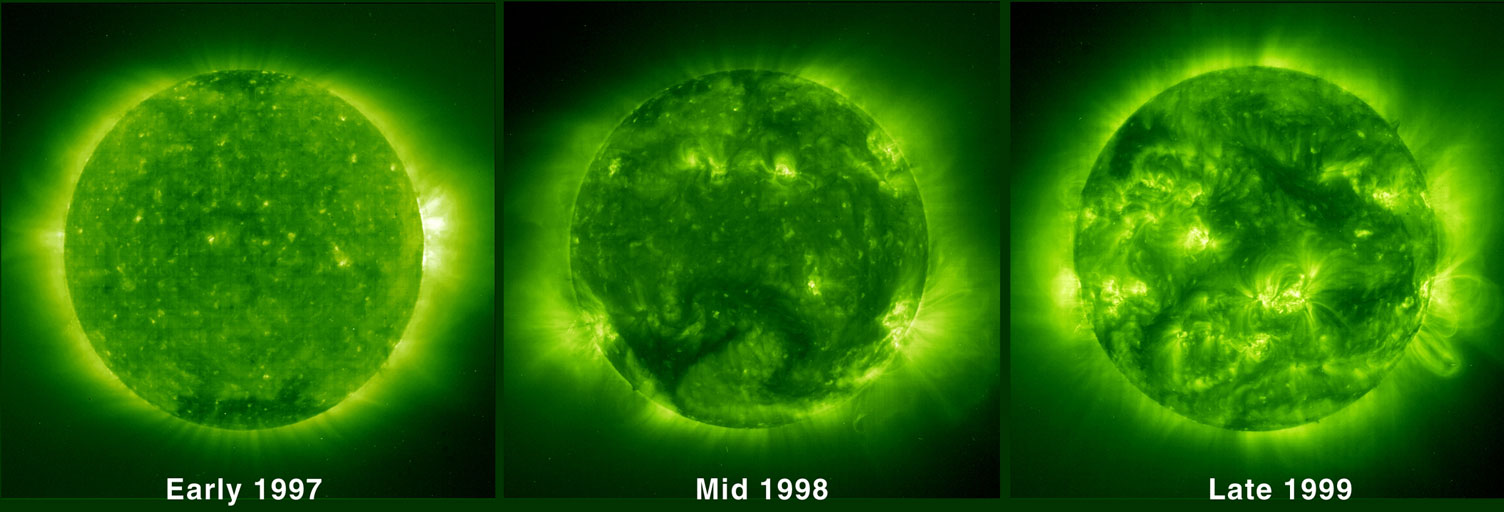
Most of the corona is trapped close to Sun by loops of magnetic field lines. In X-rays, those regions appear bright. Some magnetic field lines do not loop back to the Sun and will appear dark in X-rays. These places are called ``coronal holes''. The sequence of pictures shows the increasing level of solar activity as the Sun headed toward solar maximum in the year 2000.
More details in the corona are seen
when looking in the higher energy regions of the electromagnetic spectrum than
visible light (extreme ultraviolet image from the SOHO spacecraft, courtesy
of NASA and ESA).
Images of today's corona and the transition zone between the chromosphere and corona are available on the SOHO website, the Solar Dynamics Observatory website, and the Daniel K. Inouye Solar Telescope website (they also have timelapse movies)
Other pictures in stereo (use 3D cyan-red glasses), movies, and other data of the Sun's corona are available from NASA's STEREO mission (and other site)---two nearly identical space observatories, one ahead of the Earth in its orbit and one trailing behind, will trace the flow of energy and matter from the Sun to the Earth.
Fast-moving ions can escape the Sun's gravitational attraction. Moving outward at hundreds of kilometers/second, these positive and negative charges travel to the farthest reaches of the solar system. They are called the solar wind. The solar wind particles passing close to a planet with a magnetic field are deflected around the planet. Fluctuations in the solar wind can give energy to the trapped charged particles in the planet's radiation belts. Particles with enough energy can leave the belts and spiral down to the atmosphere to collide with molecules and atoms in the thermosphere of the planet. When the charged particles hit the planet's atmosphere, they make the gas particles in the atmosphere produce emission spectra---the aurorae (see the aurorae section in the planets chapter for more details). During solar maximum the increased number and energy of the solar wind particles produce more extensive auroral displays in the Earth's atmosphere---the aurorae can even be seen by those at latitudes near 30° north or south! Usually, aurorae are seen by only those above 50° N latitude (or 50° S latitude for the aurora australis). The effects of the solar wind on the Earth is described more fully in the NOAA Space Weather Prediction Center and NASA's Solar Dynamics Observatory.
| aurorae | chromosphere | convection zone |
|---|---|---|
| core (stellar) | corona | granulation |
| ionization | photosphere | radiative zone |
| solar wind | sunspots |
![]() Go back to previous section --
Go back to previous section --
![]() Go to next section
Go to next section
last updated: June 19, 2022